Unlocking Market Insights: A Comprehensive Guide to Trading View
In the fast-paced world of trading and investing, access to real-time data, powerful analytical tools, and community insights can significantly influence decision-making. That’s where trading view emerges as a game-changer, integrating charting, social interaction, and advanced analytics into one versatile platform. Whether you’re a novice trader or a seasoned investor, understanding how to leverage Trading View’s features can elevate your market analysis and trading strategies. This comprehensive guide explores the fundamental and advanced aspects of Trading View, providing actionable insights to help you harness its full potential.
Understanding the Basics of Trading View
What is Trading View and How Does It Work?
Trading View is a multifaceted financial analysis platform designed to empower traders and investors with robust charting tools, real-time data, and an active community. Bridging the gap between technical analysis and social engagement, it serves as both a charting application and a social network where users share ideas, strategies, and market sentiment. The platform operates through a web-based interface, complemented by mobile apps available on Android and iOS, offering seamless access across devices.
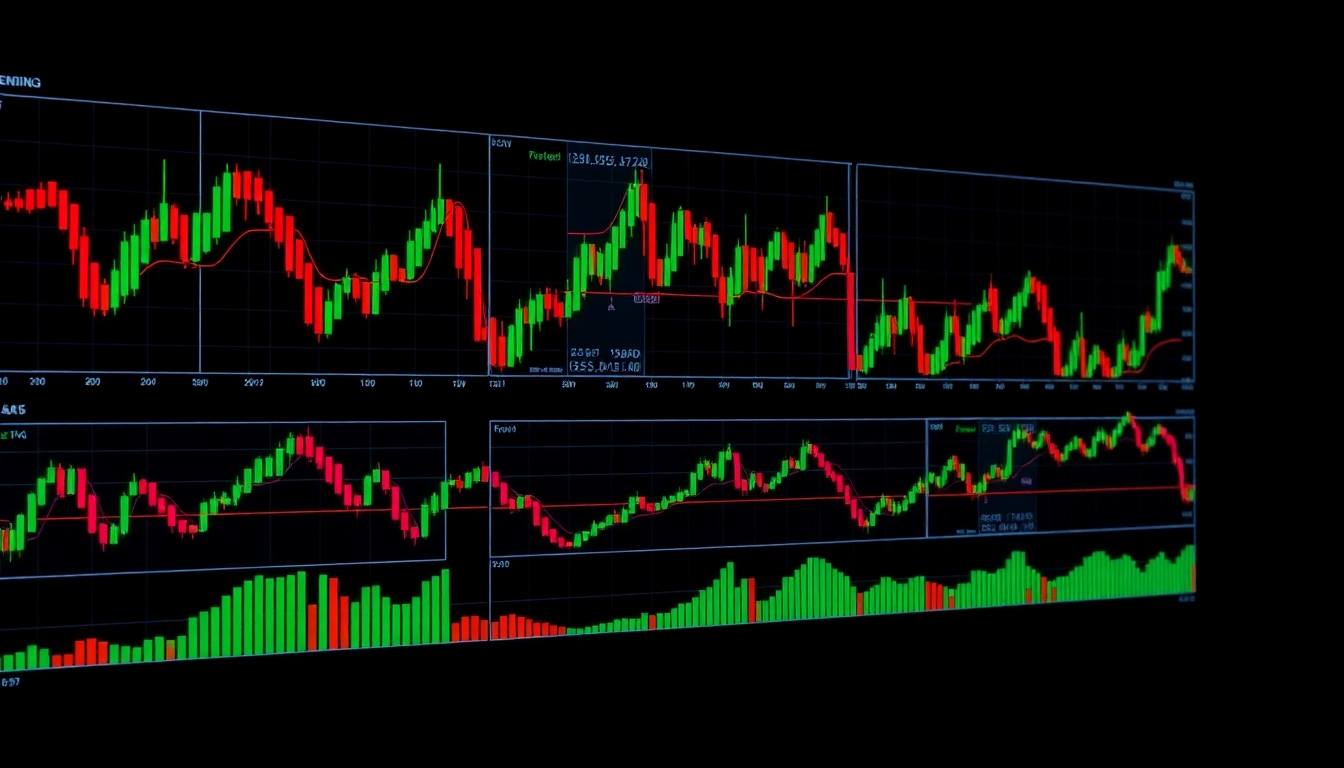
The platform’s core functionality revolves around customizable charts that display price movements of various assets such as stocks, cryptocurrencies, forex pairs, commodities, and indices. These charts are equipped with diverse technical indicators, drawing tools, and scripting capabilities, allowing users to perform detailed technical analysis with precision.
For those interested, Trading View also integrates with brokerage accounts, enabling users to execute trades directly from the platform. Its open ecosystem supports a wide array of assets, making it an all-in-one tool for comprehensive market analysis.
Key Features and Tools for Effective Market Analysis
- Advanced Charting Capabilities: Multiple chart types (candlestick, line, bar, etc.) with adjustable timeframes.
- Technical Indicators: Hundreds of pre-built indicators (Moving Averages, RSI, Bollinger Bands, etc.) and the ability to create custom scripts via Pine Script.
- Drawing Tools: Trendlines, Fibonacci retracements, Gann fans, and more for pinpointing support and resistance levels.
- Real-Time Data and Alerts: Instant notifications on price movements or indicator signals, helping traders act swiftly.
- Community and Idea Sharing: A vibrant social network where users publish charts, insights, and market forecasts, fostering collaborative learning.
Setting Up Your Trading View Account
Getting started is straightforward. Simply create a free account on the platform or opt for premium plans for additional features. Once registered, users can customize their workspace, organize watchlists, and explore community ideas. A well-structured setup—tailoring charts to preferred timeframes and indicators—sets the foundation for effective analysis. Account settings also allow notifications, privacy controls, and integration options, enhancing usability and security.
Advanced Techniques for Using Trading View
Customizing Charts for Better Insights
Customizing charts extends beyond mere aesthetic preferences; it’s about optimizing tools to decode market behavior. Users can create multiple layout templates—focusing on daily, weekly, or intraday views—and save them for quick recall. Color schemes, grid options, and aggregation settings help distinguish different asset classes or trading strategies. Incorporating overlaying assets, such as comparing Bitcoin with Ethereum, can reveal correlations or divergences crucial for informed decisions.
Employing multi-timeframe analysis allows traders to observe broader trends while fine-tuning entry and exit points on shorter intervals. Combining these practices results in a layered understanding of the market, reducing blind spots and enhancing predictive accuracy.
Using Indicators and Drawing Tools Effectively
Indicators are the backbone of technical analysis, but overloading charts can lead to confusion. It’s vital to select a balanced set—such as trend identifiers (Moving Averages), momentum oscillators (RSI, MACD), and volatility measures (Bollinger Bands). Pine Script enables custom indicator creation, adapting analysis to specific trading styles.
Drawing tools like trendlines, channels, and Fibonacci retracements help contextualize indicator signals. For instance, a moving average crossover coupled with a trendline break can serve as a robust entry signal. Consistent practice in combining tools fosters deeper market understanding.
Integrating Trading View with Other Platforms
Trading View supports integration with multiple brokerage accounts, enabling seamless trade execution. Additionally, its open API allows linking with third-party analytics tools or automated systems. For example, traders might employ backtesting software or machine learning models alongside Trading View charts to validate strategies before real-time deployment.
Strategies to Maximize Trading View’s Potential
Developing Technical Trading Strategies
Building effective trading strategies starts with defining clear criteria—such as trend-following, counter-trend, or breakout approaches. Trading View supports this through its scripting capabilities, enabling automation of rule-based strategies. For example, a simple moving average crossover system can be programmed to generate buy/sell signals automatically.
Backtesting these strategies on historical data allows traders to evaluate performance without risking capital. Iterative refinement—adjusting indicator periods, risk management rules, and entry/exit points—enhances robustness and consistency in live trading.
Leveraging Alerts and Notifications for Timely Decisions
One of Trading View’s standout features is its alert system. Users can set precise notifications based on price levels, indicator thresholds, or drawing tool conditions. These alerts can be delivered via email, SMS, or in-app notifications, ensuring traders stay informed regardless of their screen time. Properly configured alerts serve as cost-effective signals, helping to capture profitable opportunities and minimize losses.
Analyzing Community Ideas and Market Sentiment
The social aspect of Trading View provides invaluable insights. Community ideas—charts posted by other traders—offer different perspectives and analyses. Monitoring popular ideas or trending discussions offers a pulse on collective market sentiment, which can complement technical analysis. Critical evaluation of community inputs, combined with your own analysis, fosters a more holistic view of market dynamics.
Best Practices and Common Challenges
Ensuring Data Accuracy and Reliability
While Trading View sources data from reputable providers, discrepancies can occur, especially during high volatility or low liquidity periods. Cross-verifying data with official exchange feeds or through multiple platforms helps maintain accuracy. Keeping the platform and its plugins updated ensures compatibility and security.
Managing Screen Time and Information Overload
With an abundance of data, traders risk burnout or analysis paralysis. Establishing a structured routine—focusing on specific markets or timeframes—prevents overwhelm. Utilizing alerts and setting predefined criteria for trade entries reduces the temptation for incessant screen watching. Regularly reviewing and trimming your watchlists ensures you stay focused on high-probability setups.
Keeping Your Skills Updated with New Features
Trading View continuously evolves, introducing new tools, indicators, and integrations. Staying informed via platform updates, webinars, or community forums helps traders leverage these enhancements. Experimentation and training are key; dedicating time to learn new features can unlock additional strategic possibilities.
Measuring Success and Improving Your Trading Performance
Setting Goals and Tracking Progress
Effective traders set measurable goals—such as achieving a specific ROI, refining a trading strategy, or mastering a new indicator. Maintaining a trading journal within Trading View or external tools allows tracking of trades, reasoning, and outcomes, facilitating continuous learning.
Utilizing Backtesting and Simulation Tools
Backtesting on historical data provides confidence in strategy viability. Trading View enables this through its Pine Script backtester, which allows simulation of trading rules over diverse market conditions. Regular testing and parameter adjustments optimize performance and adapt strategies to evolving markets.
Learning from Market Trends and Past Trades
Analyzing past trades and market cycles helps identify strengths and weaknesses. Incorporating lessons learned into future analysis—such as recognizing false breakouts or over-reliance on certain indicators—improves decision-making. Continuous education and adaptation are crucial to long-term success.